Create Presentation Slides from Your Documents
Transform your existing documents or agent-generated content into professional, interactive HTML presentations instantly. No copying, no switching tools, and no export or import workflow.
Quick Navigation
- Overview - Problem, solution, and what you'll achieve
- Step-by-Step Setup — How to set up
- Instruction Examples — Copy-paste prompts for 3 presentation types
- Review & Refine — Verify and correct output
- How to Improve Results — Tips and best practices
- Troubleshooting — Common issues and solutions
Overview
Problem It Solves
Turning existing content into presentation slides is often slow and fragmented:
- Manual copy-paste between ChatGPT and PowerPoint/Canva
- Formatting lost when transferring content
- Context switching across multiple tools
- Version chaos managing files in different places
- Update nightmare repeating the entire process for changes
Common Pain Point
Creating a presentation from existing content can easily take 1–2 hours, with most of the time spent copying, reformatting, and switching between tools.
Why This Is Different with FabriXWork
Traditional AI + Presentation Tools:
Generate in ChatGPT → Copy → Open PowerPoint → Paste → Format → Export → Share
                              ↑                                            │
                              └──────── Need changes? Start over ─────────┘
With FabriXWork:
FabriXWork agent can help you transform documents into presentations in the same workspace. Same content, proper slide format, zero copying.
Your Document → Agent → "Transform to slides" → Done
      ↑              │
      └── Update source, regenerate ──┘
Key Advantage
Your content stays in your workspace. No copying, no format loss, no tool switching. Update the source, regenerate in seconds.
What You Will Achieve
By following this guide, you will be able to:
✅ Instantly transform existing documents into structured slide decks
✅ Keep all content organized in a single workspace with no scattered files
✅ Generate professionally structured, presentation-ready slides automatically
✅ Save 1–2 hours typically spent on manual copy-paste and formatting
✅ Export a fully interactive HTML presentation that runs in any web browser
✅ Update your source content and regenerate slides in seconds whenever changes are needed
Time to complete: 10-15 minutes (vs. 1-2 hours with the traditional copy-paste workflow)
Output: Interactive HTML presentation file that can be opened and presented in any web browser
Complexity Level: 🟢 Beginner
Presentation Types Demonstrated in This Guide
This guide demonstrates 3 common presentation types with ready-to-use prompts. Use these templates as-is or adapt them for your specific needs.
| Type | Goal | Example Use Case |
|---|---|---|
| Persuasive | Convince audience to act | Sales pitch to prospective client |
| Status & Reporting | Report progress/performance | Quarterly KPI review with executives |
| Comparative | Enable side-by-side evaluation | AI tool evaluation for leadership |
Not seeing your exact use case?
The prompts below are templates. Adapt the structure, slide count, and content to match your specific presentation needs.
Recommended Workflow: Plan First, Then Build
For complex presentations, use a two-step approach for best results:
Step 1 - Plan Mode: Ask your agent to analyze your content and propose a slide structure before building. This helps validate that the agent understands your presentation goals, identifies missing content early, and allows you to adjust the flow before slides are created.
Step 2 - Build Mode: Once you approve the plan, ask your agent to build the presentation following the approved structure. This reduces revisions and ensures better quality since the agent has time to think through the narrative flow.
How to Switch Modes:
Click the mode selector dropdown under the input box and choose between Plan or Build:
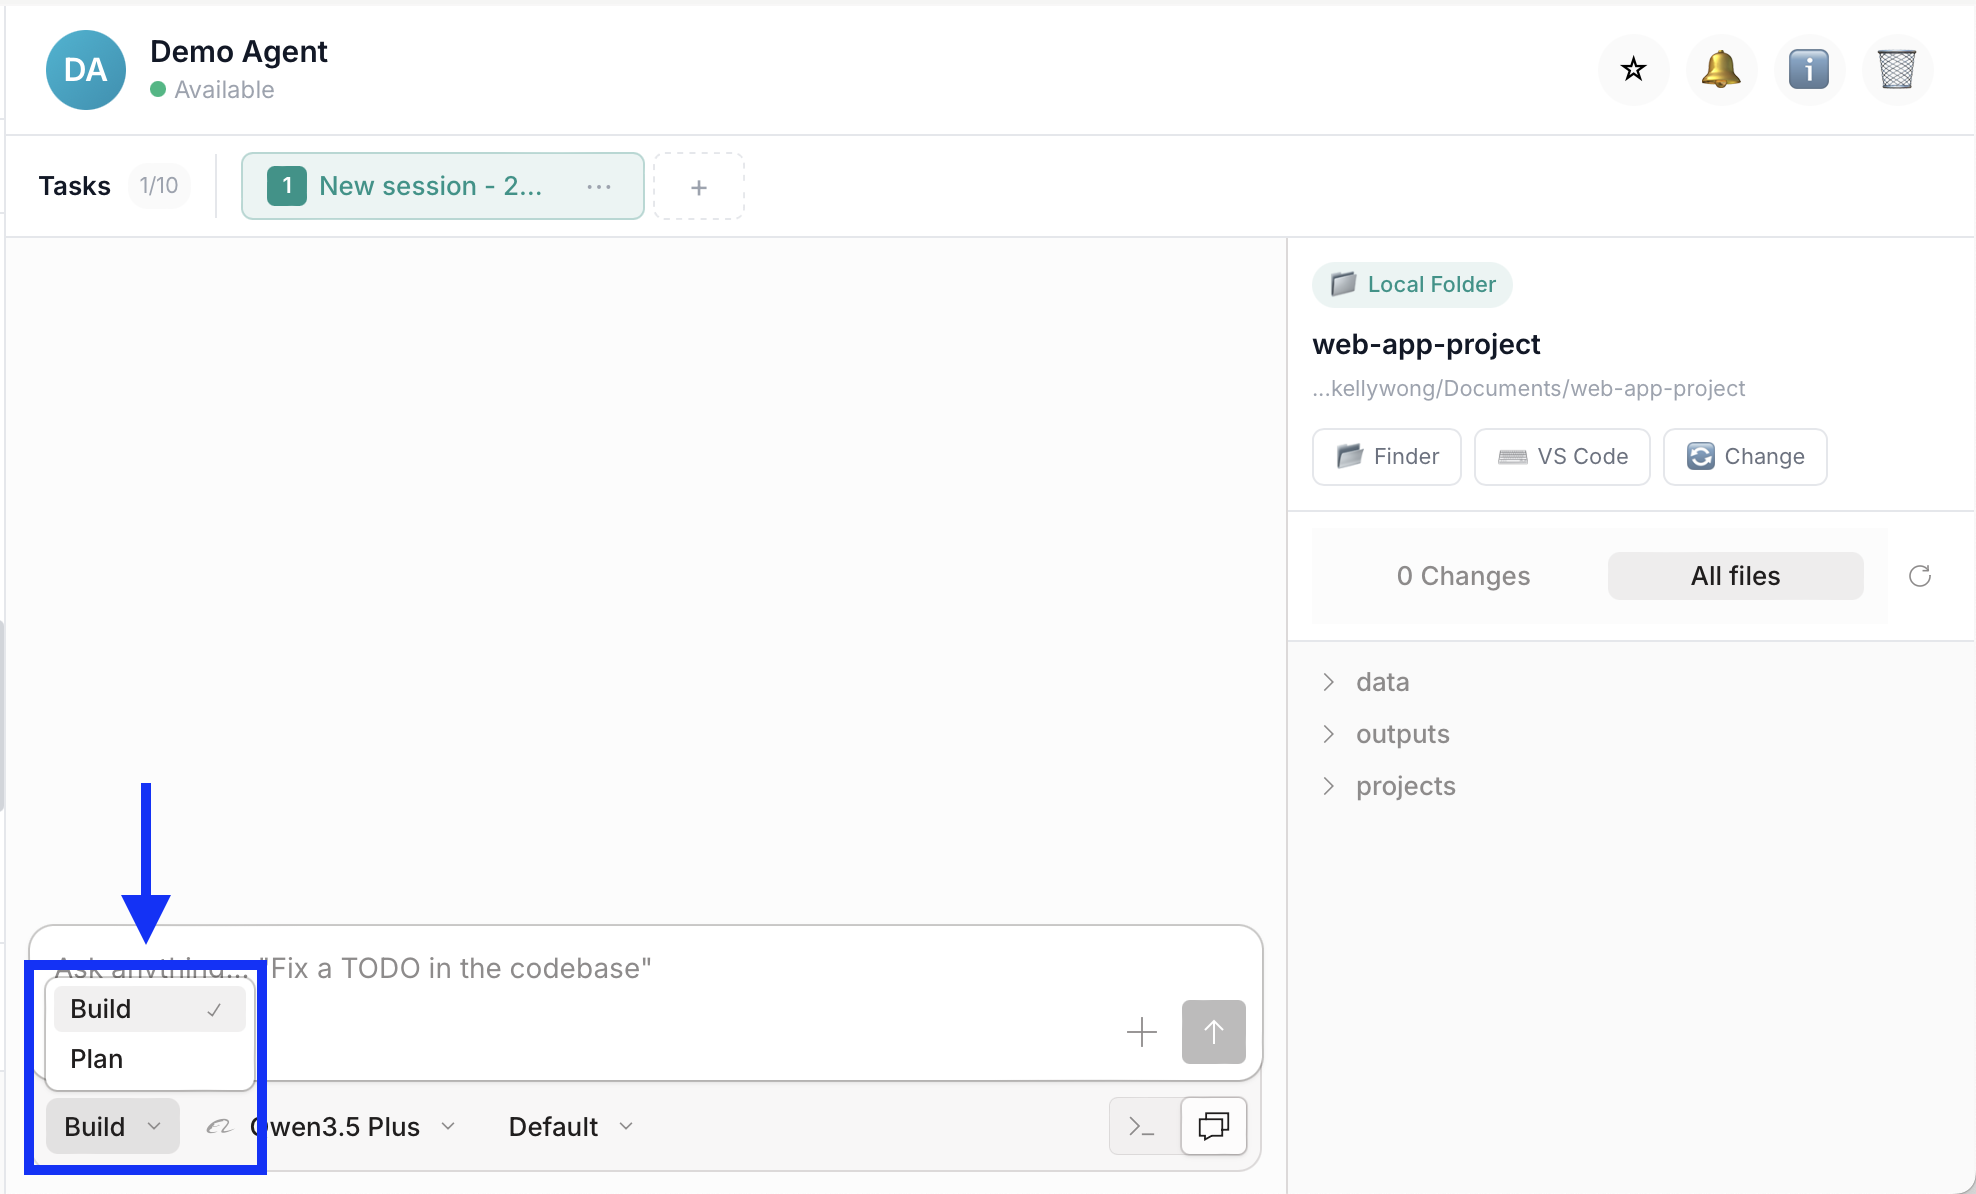
Start in Plan mode to review the proposed structure, then switch to Build mode to create the presentation.
Why this workflow is more effective: Catches issues early (easier to adjust a plan than refactor slides), aligns expectations, reduces revisions, and results in better quality output.
Step-by-Step Setup
Step 1: Prepare Your Content
Before starting, gather:
- Source document: The content you want to transform (strategy doc, research report, analysis, etc.)
- Supporting files: Any Excel/CSV with data, charts, or background info
- Audience context: Who will see this? (executives, team, clients)
- Presentation goal: What decision or action do you want from the audience?
Step 2: Choose Your Agent
You can use any AI agent in FabriXWork to create presentations. All agents support the frontend-slides skill for generating interactive HTML presentations.
- If you already have an agent: Use the agent you're currently working with (they already know your context and content)
- If you need a new agent: For business presentations, Alex - Business Analyst is recommended for content structuring expertise
- If you haven't added any agent yet: Follow the Add Your First Agent guide first
Step 3: Connect Your Folder
Skip This Step If...
You're already working with an agent and your files are in the connected folder. Only follow this step if you're adding a new agent or need to connect a different folder.
If you are adding a new agent:
Follow Connect to Local Folder to connect your agent to a local folder.
If you want to connect a different folder:
- Select your agent from the sidebar
- In the right panel, click "Change" to connect a folder
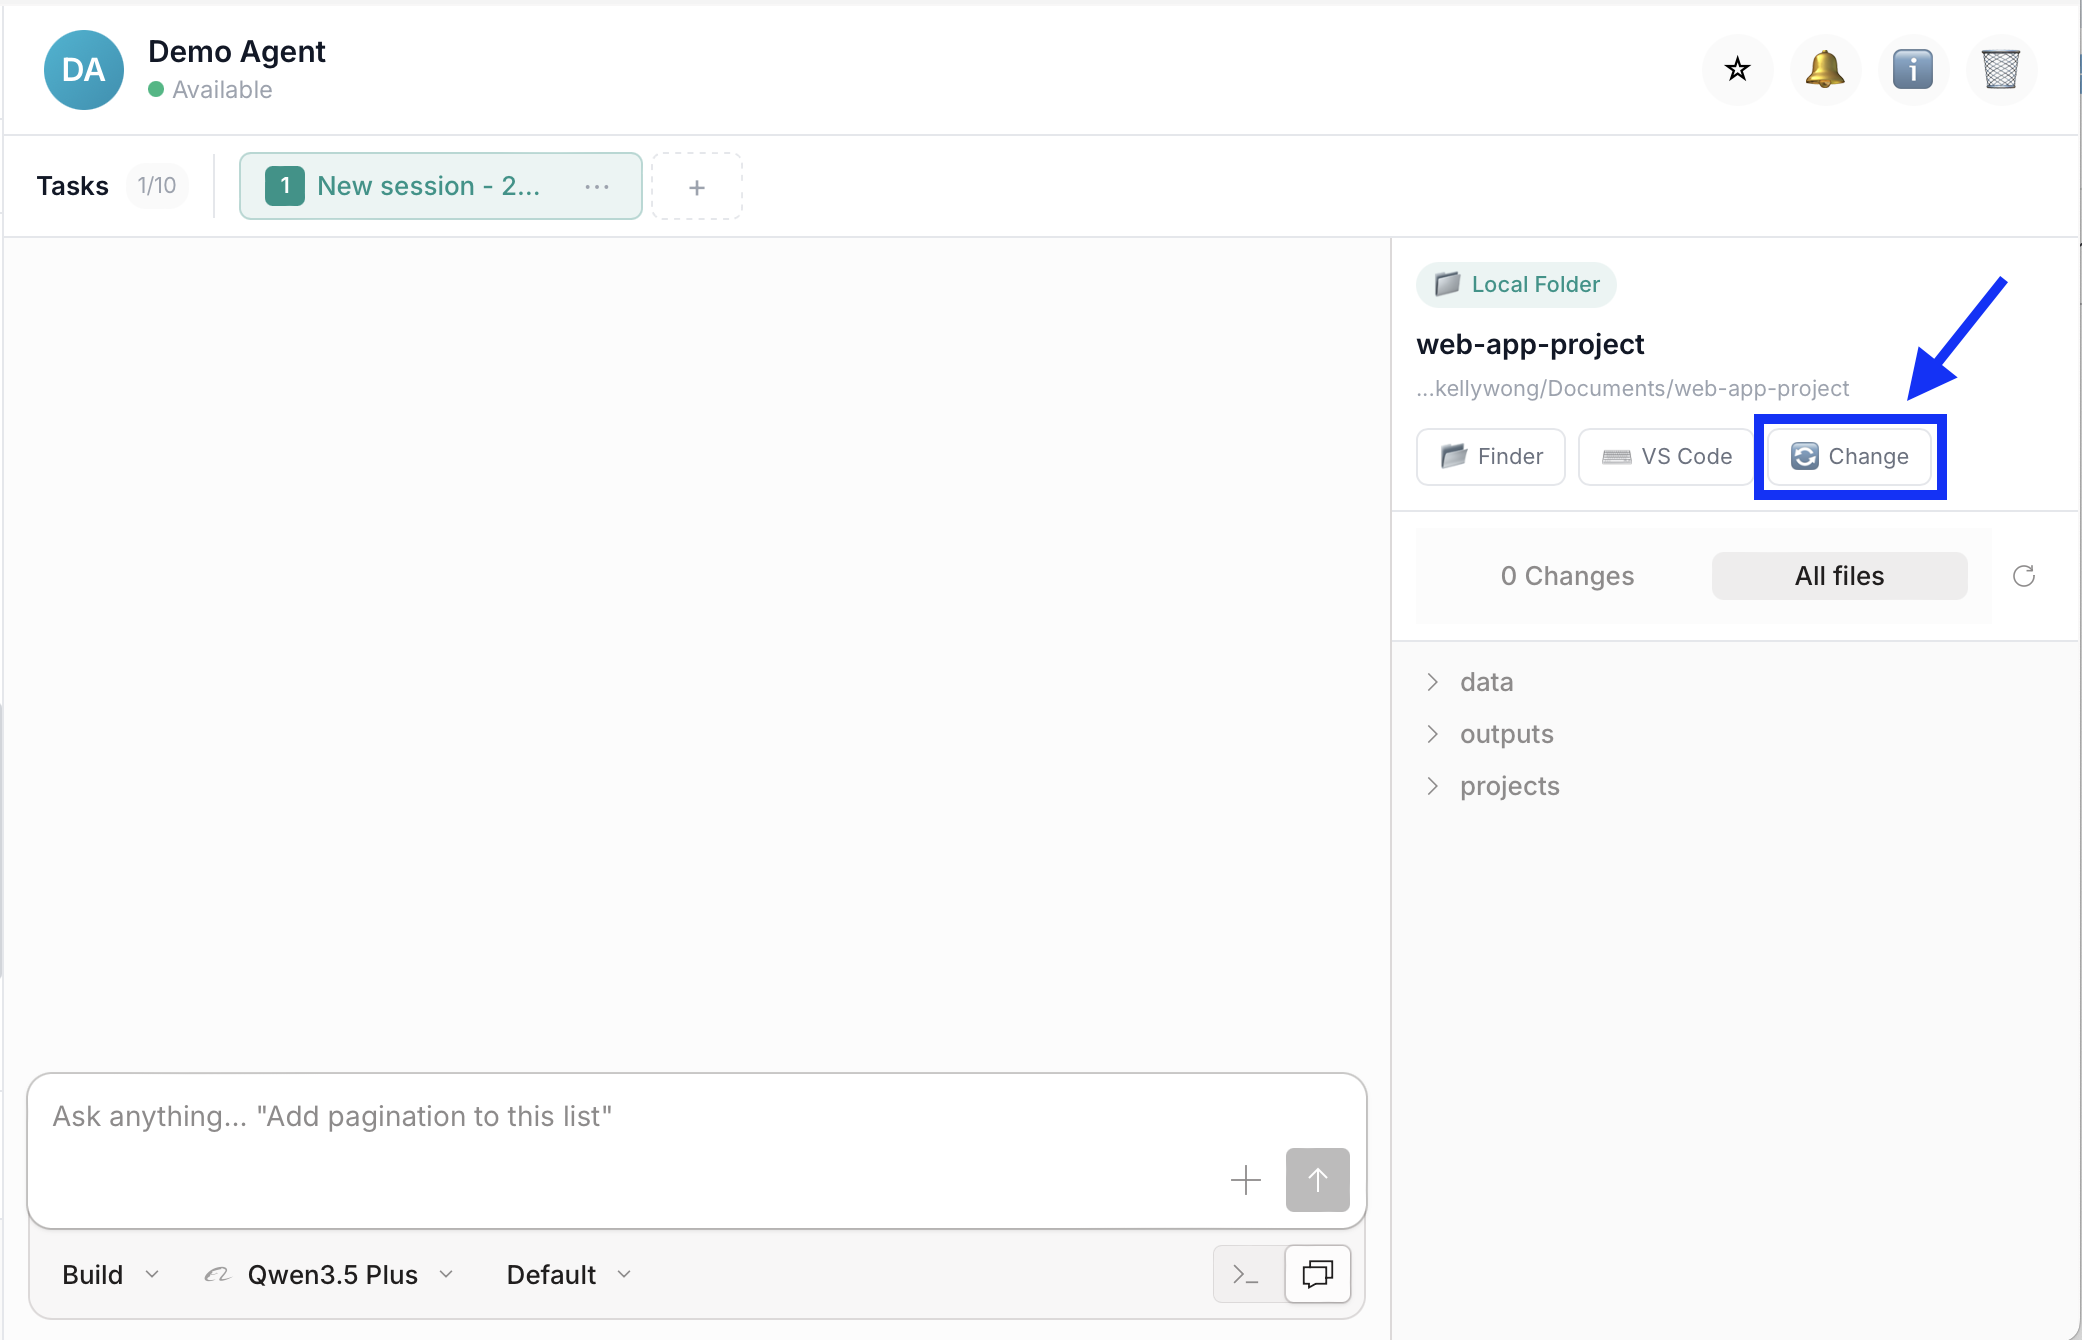
- Add your files into that folder
Step 4: Give Your Instruction
To generate your presentation, use one of the instruction examples in the next section as your starting point. Choose the example that best matches your presentation type, then replace the sample file names and details with your own.
Instruction Examples
Example 1: Persuasive Presentation (Sales Pitch)

When to Use This Type
Use this structure when: pitching to clients, requesting budget, proposing projects, or any situation where you need audience to take action.
Background: You're pitching to a prospect tomorrow. Your agent helped create a custom proposal yesterday. Now you need a compelling pitch deck.
Sample Files Ready in Your Folder:
client-proposal.md— Custom solution documentpricing.xlsx— Pricing breakdowncase-studies.md— Relevant client success stories
Your Prompt:
💡 Pro Tip: Use Plan Mode first (see workflow above) to review the proposed structure before building.
Transform my client-proposal.md into a persuasive sales pitch deck with frontend-slides skill.

Structure: Problem (2 slides) → Solution (2 slides) → Proof (2 slides) → CTA (1 slide)
Tone: Confident, client-focused
Save to: [folder]/[file-name].html

Optional: Add speaker notes | Include branding colors | Add case study testimonials
Expected Output:
8-10 slide persuasive deck flowing from problem → solution → proof → CTA
Customization Tips
For the sales pitch example:
[Structure]→ "Problem (2 slides) → Solution (2 slides) → Proof (2 slides) → CTA (1 slide)"[Tone]→ "Confident, client-focused"[Optional]→ "Add speaker notes, include branding colors, add case study testimonials"
For a product launch:
[Structure]→ "Market Opportunity → Solution → GTM Strategy → Metrics"[Tone]→ "Professional, data-driven"
Layout Tips for Persuasive Decks
✅ Do: Lead with problem/pain, one proof per slide, clear CTA at end
❌ Don't: Bury the ask, lead with features, use dense text
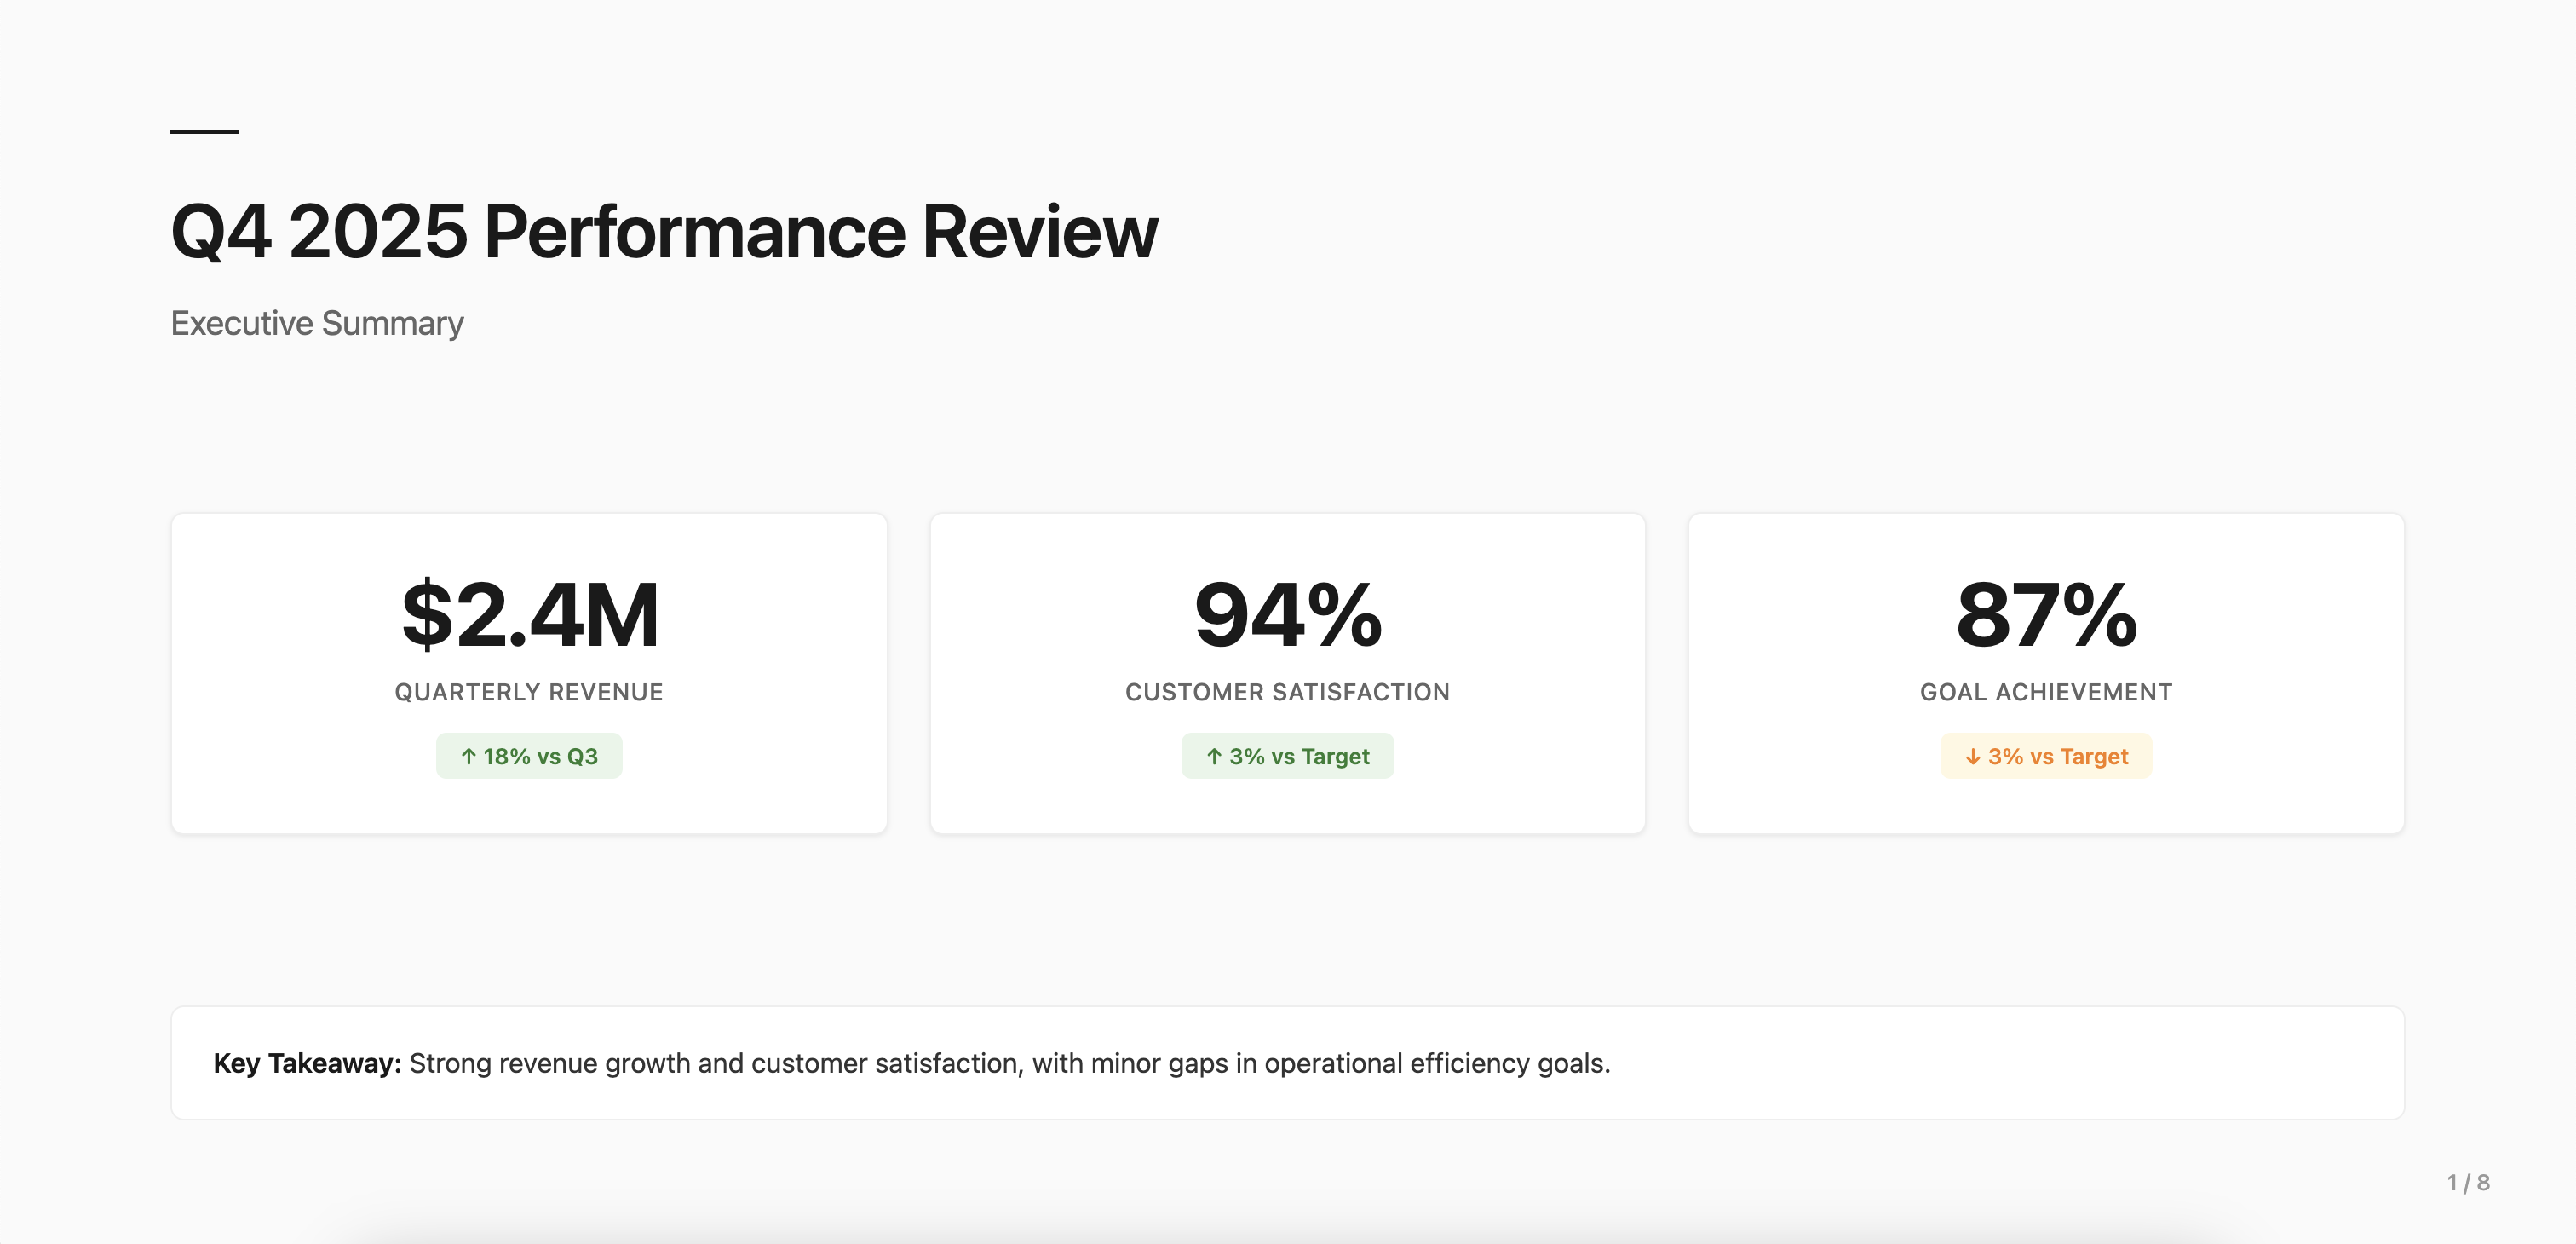
Example 2: Status & Reporting (Q4 KPI Review)
When to Use This Type
Use this structure when: quarterly reviews, monthly performance updates, board meetings, stakeholder reports, or any progress reporting scenario.
Background: Quarterly business review with executives next week. Your agent compiled all Q4 metrics and analysis. Transform into executive-ready deck.
Files Ready in Your Folder:
q4-performance.md— Quarterly performance analysiskpi-dashboard.xlsx— Metrics and targetsteam-achievements.md— Key wins and milestones
Your Prompt:
💡 Pro Tip: Use Plan Mode first (see workflow above) to review the proposed structure before building.
Transform my Q4-performance.md into an executive KPI review deck with frontend-slides skill.

Structure: Executive Summary → Goals vs Actuals (visual) → Wins → Challenges → Q1 Priorities
Tone: Professional, data-driven, concise
Save to: [folder]/[file-name].html

Optional: Add appendix with full data | Include team recognition | Add trend analysis slides
Expected Output:
10-12 slide executive report with metrics, wins, challenges, next quarter plan
Customization Tips
For the Q4 KPI review example:
[Structure]→ "Executive Summary → Goals vs Actuals (visual) → Wins → Challenges → Q1 Priorities"[Tone]→ "Professional, data-driven, concise"[Optional]→ "Add appendix with full data, include team recognition, add trend analysis slides"
For a monthly team update:
[Structure]→ "Summary → Key Metrics → Wins → Blockers → Next Month Goals"[Tone]→ "Concise, action-oriented"
Layout Tips for Status Reports
✅ Do: Executive summary first, visual metrics (charts/traffic lights), highlight variances
❌ Don't: Hide bad news, use dense tables, skip recommendations
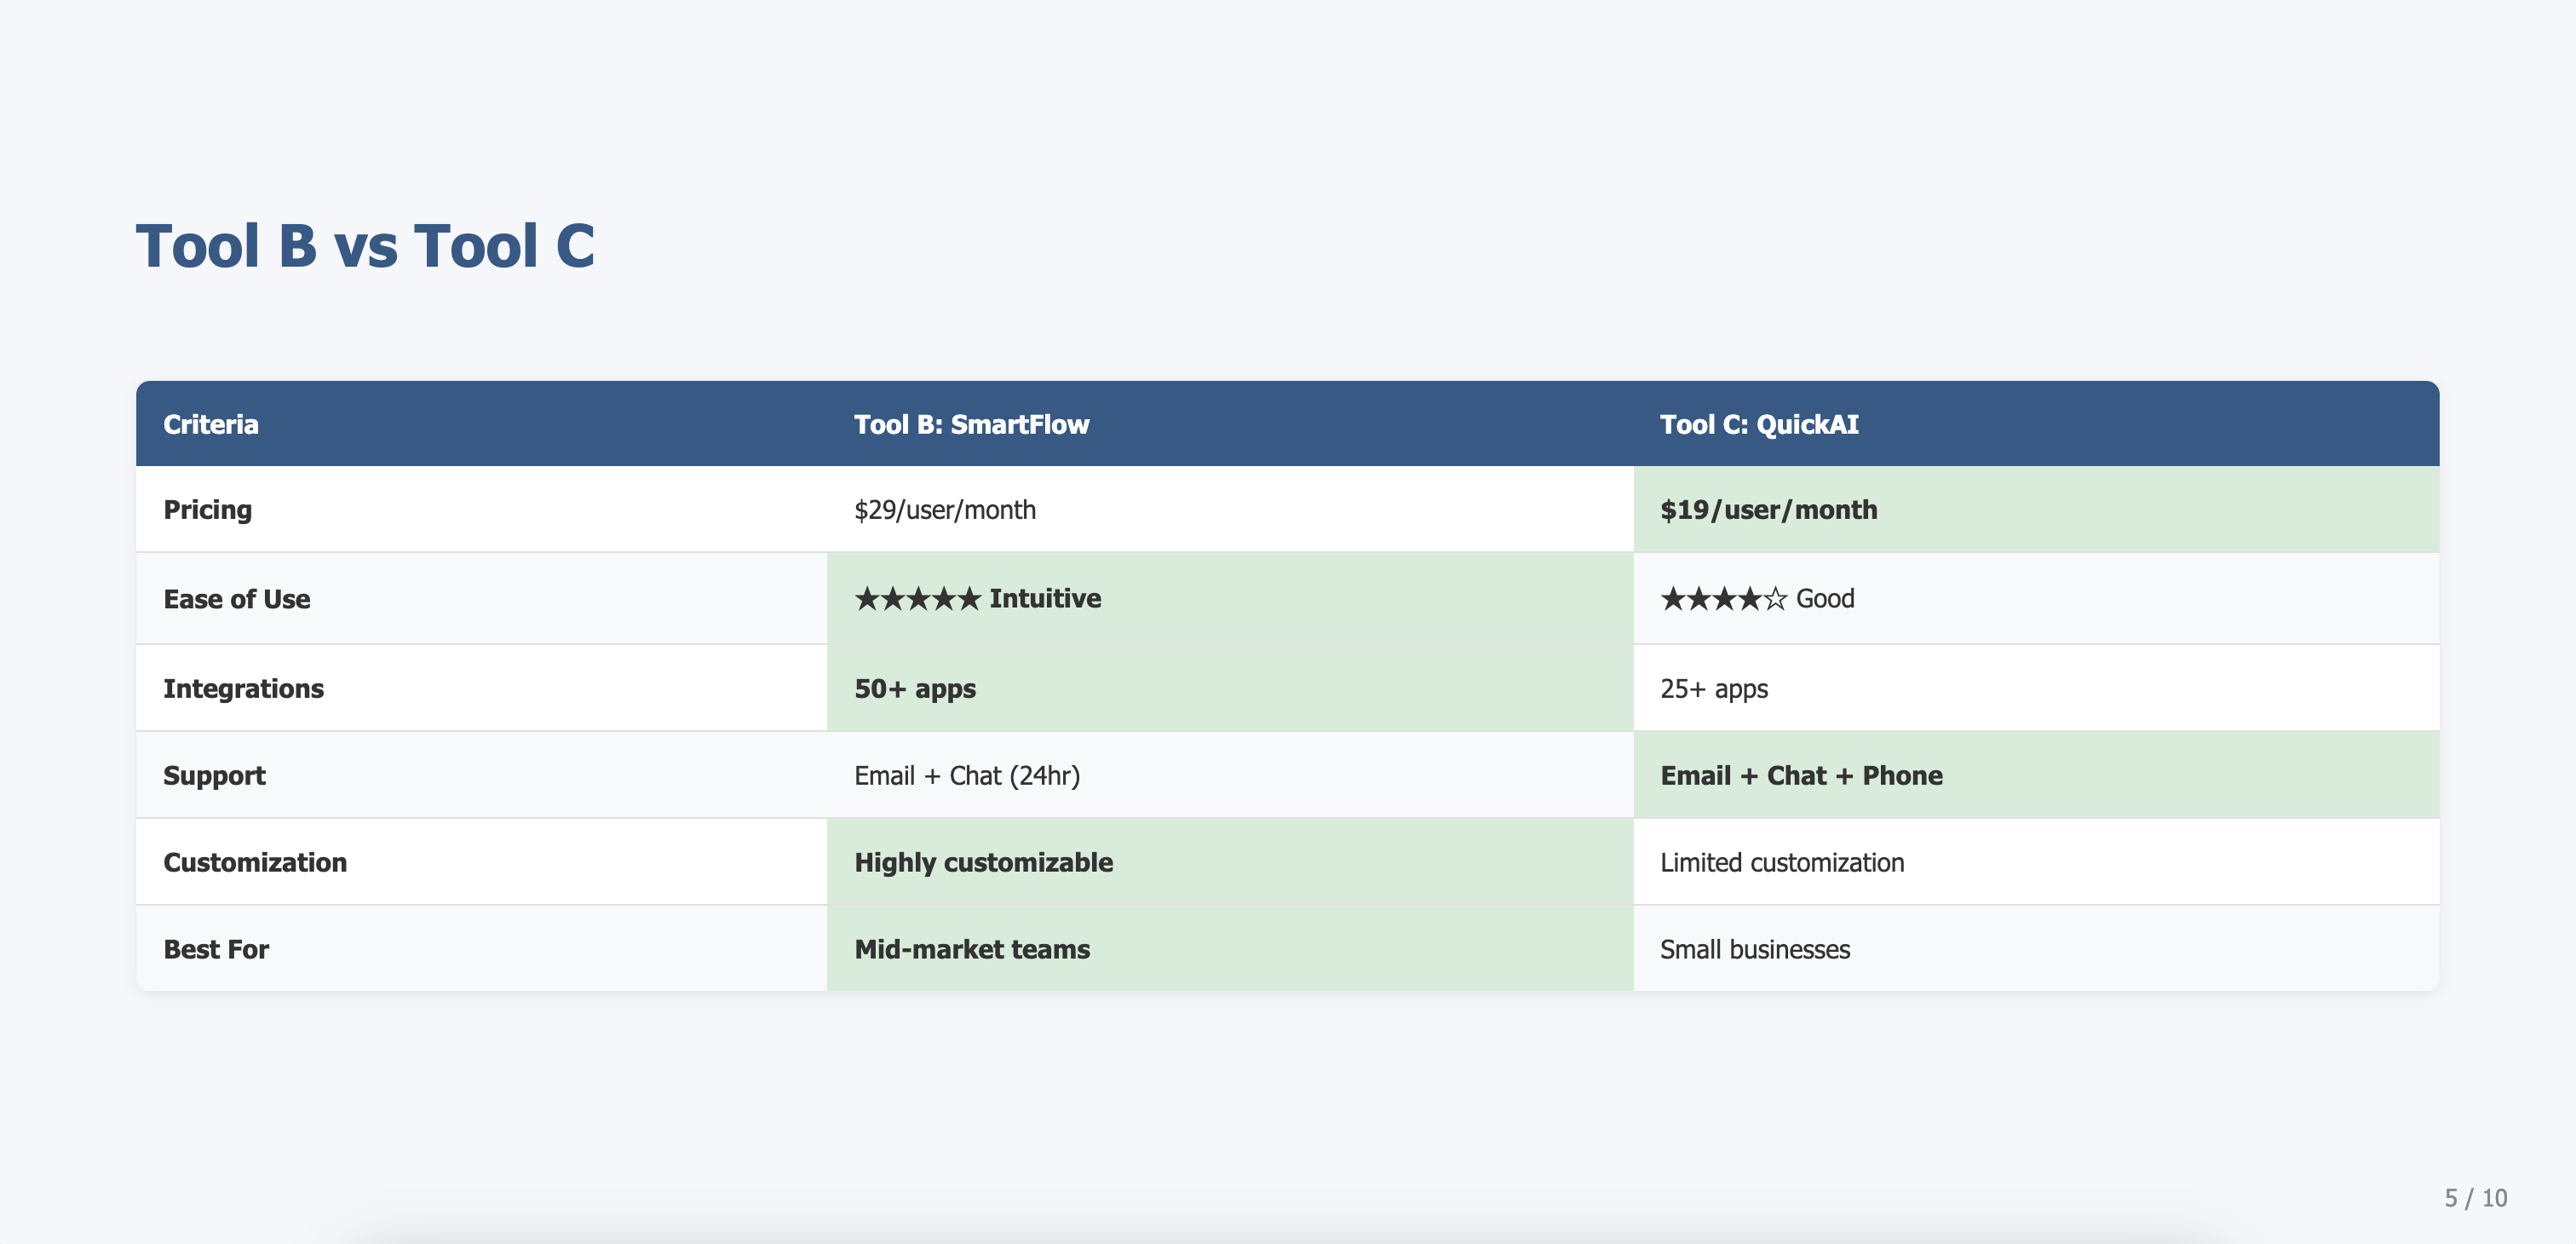
Example 3: Comparative (AI Tool Evaluation)
When to Use This Type
Use this structure when: vendor selection, tool evaluation, product comparisons, or any scenario requiring side-by-side assessment.
Background: You evaluated 3 AI tools for your team. Your agent documented each vendor's features, pricing, and pros/cons. Create comparison deck for leadership decision.
Files Ready in Your Folder:
tool-a-analysis.md— First AI tool evaluationtool-b-analysis.md— Second AI tool evaluationtool-c-analysis.md— Third AI tool evaluationcomparison-criteria.md— Evaluation framework
Your Prompt:
💡 Pro Tip: Use Plan Mode first (see workflow above) to review the proposed structure before building.
Transform my AI tool analyses into a comparison deck with frontend-slides skill.

Structure: Criteria → Tool A → Tool B → Tool C (identical structure) → Comparison Matrix → Recommendation
Tone: Objective, factual, balanced
Save to: [folder]/[file-name].html

Optional: Add TCO analysis | Include implementation timeline | Add security comparison
Expected Output:
6-8 slides: criteria, one slide per vendor (same structure), comparison matrix, recommendation
Customization Tips
For the AI tool evaluation example:
[Structure]→ "Criteria → Tool A → Tool B → Tool C (identical structure) → Comparison Matrix → Recommendation"[Tone]→ "Objective, factual, balanced"[Optional]→ "Add TCO analysis, include implementation timeline, add security comparison"
For a vendor selection:
[Structure]→ "Requirements → Vendor A → Vendor B → Vendor C → Comparison → Recommendation"[Tone]→ "Professional, evidence-based"
Layout Tips for Comparative Decks
✅ Do: Same structure for each candidate, one per slide, summary matrix at end
❌ Don't: Mix criteria, put multiple on one slide, skip the recommendation
Review & Refine
Important: Always Review AI-Generated Output
AI agents are powerful assistants, but human review is essential. Always verify the generated output before using, sharing, or submitting it.
What to Check
After your agent generates the output, review for:
- Accuracy — Verify data, figures, and facts match your source documents
- Completeness — Ensure all required sections or slides are completed
- Formatting — Check that the structure and styling meet your requirements
How to Request Corrections
If you find issues, continue the conversation with your agent:
For slide content:
"Slide [X] has [incorrect data/typo]. Please use the correct information from [source document] and regenerate."
For missing content:
"Section [X] is incomplete. Please extract [specific information] from [source document] and add it."
For refinements:
"The tone is too [casual/technical]. Please adjust to be more [professional/concise]."
Best Practices
✅ Do: Review the entire output, spot-check critical data, ask for clarification
❌ Don't: Assume accuracy without verification, submit without human review
Remember
Your agent is a collaborative tool. The best results come from AI efficiency + human oversight.
How to Improve Results
Tip 1: Reference Previous Work
✅ Good: "Use the product-strategy.md we created yesterday. Transform it into slides."
❌ Vague: "Make slides from my document"
Tip 2: Specify Transformation Type
✅ Good: "Convert my document to slides. Keep all data, just reformat for presentation."
❌ Vague: "Make a presentation"
Tip 3: Point to Specific Files
✅ Good: "Extract market data from market-research.xlsx for slide 3"
❌ Vague: "Use my Excel file"
Tip 4: Maintain Consistency
✅ Good: "Use the same structure and recommendations from product-strategy.md"
❌ Vague: "Make it similar to my document"
Tip 5: Request Slide Format
✅ Good: "Convert paragraphs to bullet points. Max 5 bullets per slide, max 8 words per bullet."
❌ Vague: "Make it concise"
Tip 6: Specify Interactive Features
✅ Good: "Include keyboard navigation (arrow keys), progress indicator, and speaker notes for each slide."
❌ Vague: "Make it interactive"
Tip 7: Type-Specific Tips
For Persuasive:
✅ Good: "Add 2 proof slides: one case study, one testimonial"
❌ Weak: "Add some proof"
For Status Reports:
✅ Good: "Use traffic light indicators (red/yellow/green) for each KPI"
❌ Weak: "Make it visual"
For Comparative:
✅ Good: "Keep identical slide structure for all 3 vendors"
❌ Weak: "Make them similar"
Tip 8: Test in Browser
After generating the HTML file:
- Open in Chrome/Safari/Edge/Firefox
- Test keyboard navigation (left/right arrows, spacebar)
- Verify all slides display correctly
- Check that text is readable on your screen
- Test responsive design on different screen sizes
If you notice any areas that need improvement, take a screenshot or describe the issue and ask the AI agent to refine it.
Customization Ideas
Adapt for Other Presentation Types
| Your Need | Adapt From | Key Changes |
|---|---|---|
| Training Deck | Persuasive | Replace "Problem" with "Learning Objectives", replace "CTA" with "Practice Exercise" |
| Project Proposal | Persuasive | Add "Budget" and "Timeline" slides, emphasize ROI |
| Product Launch | Status | Add "Market Opportunity" and "GTM Strategy" slides |
| Team Onboarding | Training | Add "Meet the Team" and "Your First 30 Days" slides |
| Board Update | Status | Add "Strategic Initiatives" and "Risk Overview" slides |
Transform Different Source Types
| Source Type | Transformation Approach |
|---|---|
| Strategy Document | Extract key points, convert to bullet slides |
| Research Report | Highlight findings, create data visualization slides |
| Meeting Notes | Structure into agenda, decisions, action items |
| Excel Data | Create chart slides with key metrics and insights |
| Agent Output | Transform any agent-generated content into slides |
Troubleshooting
General Issues
| Issue | Likely Cause | What to Try |
|---|---|---|
| Content doesn't match source | Agent summarized instead of transforming | “Use the exact text and data from [filename]. Do not summarize or change the content.” |
| Missing data from Excel | Specific data not clearly referenced | “Extract data from [file.xlsx], columns A–C, rows 1–10.” |
| Slides are too text-heavy | Paragraphs copied directly without formatting | “Convert paragraphs into bullet points. Max 5 bullets per slide.” |
| Changes not reflected | Source updated but slides not regenerated | “Regenerate slides using the updated document.” |
| Slides look unstyled or broken | Styling not fully applied | “Ensure the presentation includes complete styling for a clean, professional layout.” |
| Navigation not working | Interactive features not included | “Add keyboard navigation (arrow keys, spacebar) for slide control.” |
Type-Specific Issues
| Issue | Type | What to Try |
|---|---|---|
| Not persuasive enough | Persuasive | “Add 2 more proof slides: one customer testimonial and one ROI case study.” |
| Too high-level / lacks detail | Status & Reporting | “Add appendix slides with detailed data and supporting analysis.” |
| Hard to compare options | Comparative | “Use identical structure for each option: Features, Pricing, Pros, Cons.” |
| Recommendation is unclear | Comparative | “Add a final ‘Recommendation & Rationale’ slide with top 3 reasons.” |
| Missing clear next steps | Persuasive | “Add a final slide with decision required, next steps, and timeline.” |
| Metrics not visual enough | Status & Reporting | “Use visual indicators (e.g., red/yellow/green status, arrows for trends).” |
What Is frontend-slides?
All prompts in this guide use the frontend-slides skill, which generates interactive HTML presentations:
- ✅ Works in any browser (Chrome, Safari, Edge, Firefox)
- ✅ Keyboard navigation (arrow keys, spacebar)
- ✅ Self-contained file (inline CSS/JS, easy to share)
- ✅ Responsive (desktop, tablet, mobile)
- ✅ Fullscreen mode (press
F11orF)
To present: Open the .html file in a browser, press F11 for fullscreen, navigate with arrow keys.
To share: Email the file or upload to cloud storage. Recipients only need a web browser.
Related Use Cases
- Auto-Fill Forms — Populate standardized documents from structured data
- Build an Interactive Learning Tool — Create quizzes or practice exercises to accompany training presentations
- Customer Insight & Strategy Recommendations — Analyze customer data and generate insights, then transform into presentation