Customer Insight & Strategy Recommendations
Analyze customer or stakeholder data to generate actionable strategy recommendations and insights. No manual analysis, no generic advice, no hours of strategic planning.
Quick Navigation
- Overview - Problem, solution, and what you'll achieve
- Step-by-Step Setup — How to set up
- Instruction Examples — Copy-paste prompts for 3 strategy types
- Review & Refine — Verify and correct output
- How to Improve Results — Tips and best practices
- Troubleshooting — Common issues and solutions
Overview
Problem It Solves
Understanding customer behavior and developing effective strategies is challenging:
- Data scattered across multiple sources (emails, meetings, CRM, spreadsheets)
- Time-consuming to manually analyze patterns and trends
- Difficult to translate data into actionable recommendations
- Strategy development requires expertise and structured thinking
- Personalization needed for different customers or stakeholders
Common Pain Point
Manually analyzing customer data and developing strategy recommendations can take 2-4 hours, with no guarantee of actionable insights.
Why This Is Different with FabriXWork
Traditional Strategy Development:
Gather data → Manual analysis → Pattern identification → Strategy planning → Document creation
                                              ↑                                    │
                                              └──────── Need changes? Start over ──┘
With FabriXWork:
FabriXWork agent analyzes your customer data and generates structured, actionable strategy recommendations. Same insights, proper format, zero manual analysis.
Your Data → Agent → "Analyze and recommend" → Done
   ↑              │
   └── Update data, regenerate ──┘
Key Advantage
No manual analysis required. Upload your data, describe your goals, get data-backed recommendations in minutes.
What You Will Achieve
By following this guide, you will be able to:
✅ Transform raw customer data into clear, actionable insights
✅ Get structured strategy recommendations tailored to your goals
✅ Save hours of manual analysis and strategic planning time
✅ Have data-backed recommendations ready to present or implement
✅ Enable personalized approaches for different customers
Time to complete: 20-30 minutes (vs. 2-4 hours manually)
Output: Strategy document with insights, recommendations, and action plans (DOCX or Markdown format)
Complexity Level: 🟡 Intermediate
Strategy Types Demonstrated in This Guide
This guide demonstrates 3 common strategy types with ready-to-use prompts.
| Type | Goal | Example Use Case |
|---|---|---|
| Donor/Customer Engagement | Improve retention and recurring revenue | NGO donor strategy, SaaS customer retention |
| Sales Pipeline Optimization | Increase conversion rates and deal size | B2B sales strategy, account expansion |
| Product/Service Strategy | Optimize offerings based on user behavior | Feature prioritization, service improvements |
Not seeing your exact strategy type?
The prompts below are templates. Adapt the analysis, segments, and recommendations to match your specific business context.
Step-by-Step Setup
Step 1: Prepare Your Data
Before starting, gather:
- Customer data: Contact information, interaction history, purchase records, or engagement metrics
- Activity logs: Meeting notes, email summaries, call records, or communication history
- Performance data: Sales numbers, conversion rates, engagement statistics, or KPIs
- Context: Your goals (increase sales, improve retention, expand relationship, etc.)
Step 2: Choose Your Agent
You can use any AI agent in FabriXWork to analyze data and generate recommendations.
- If you already have an agent: Use the agent you're currently working with (they already know your context and content)
- If you need a new agent: For strategy analysis, Alex - Business Analyst is recommended for data analysis and pattern recognition expertise
- If you haven't added any agent yet: Follow the Add Your First Agent guide first
Step 3: Connect Your Folder
Skip This Step If...
You're already working with an agent and your files are in the connected folder. Only follow this step if you're adding a new agent or need to connect a different folder.
If you are adding a new agent:
Follow Connect to Local Folder to connect your agent to a local folder.
If you want to connect a different folder:
- Select your agent from the sidebar
- In the right panel, click "Change" to connect a folder
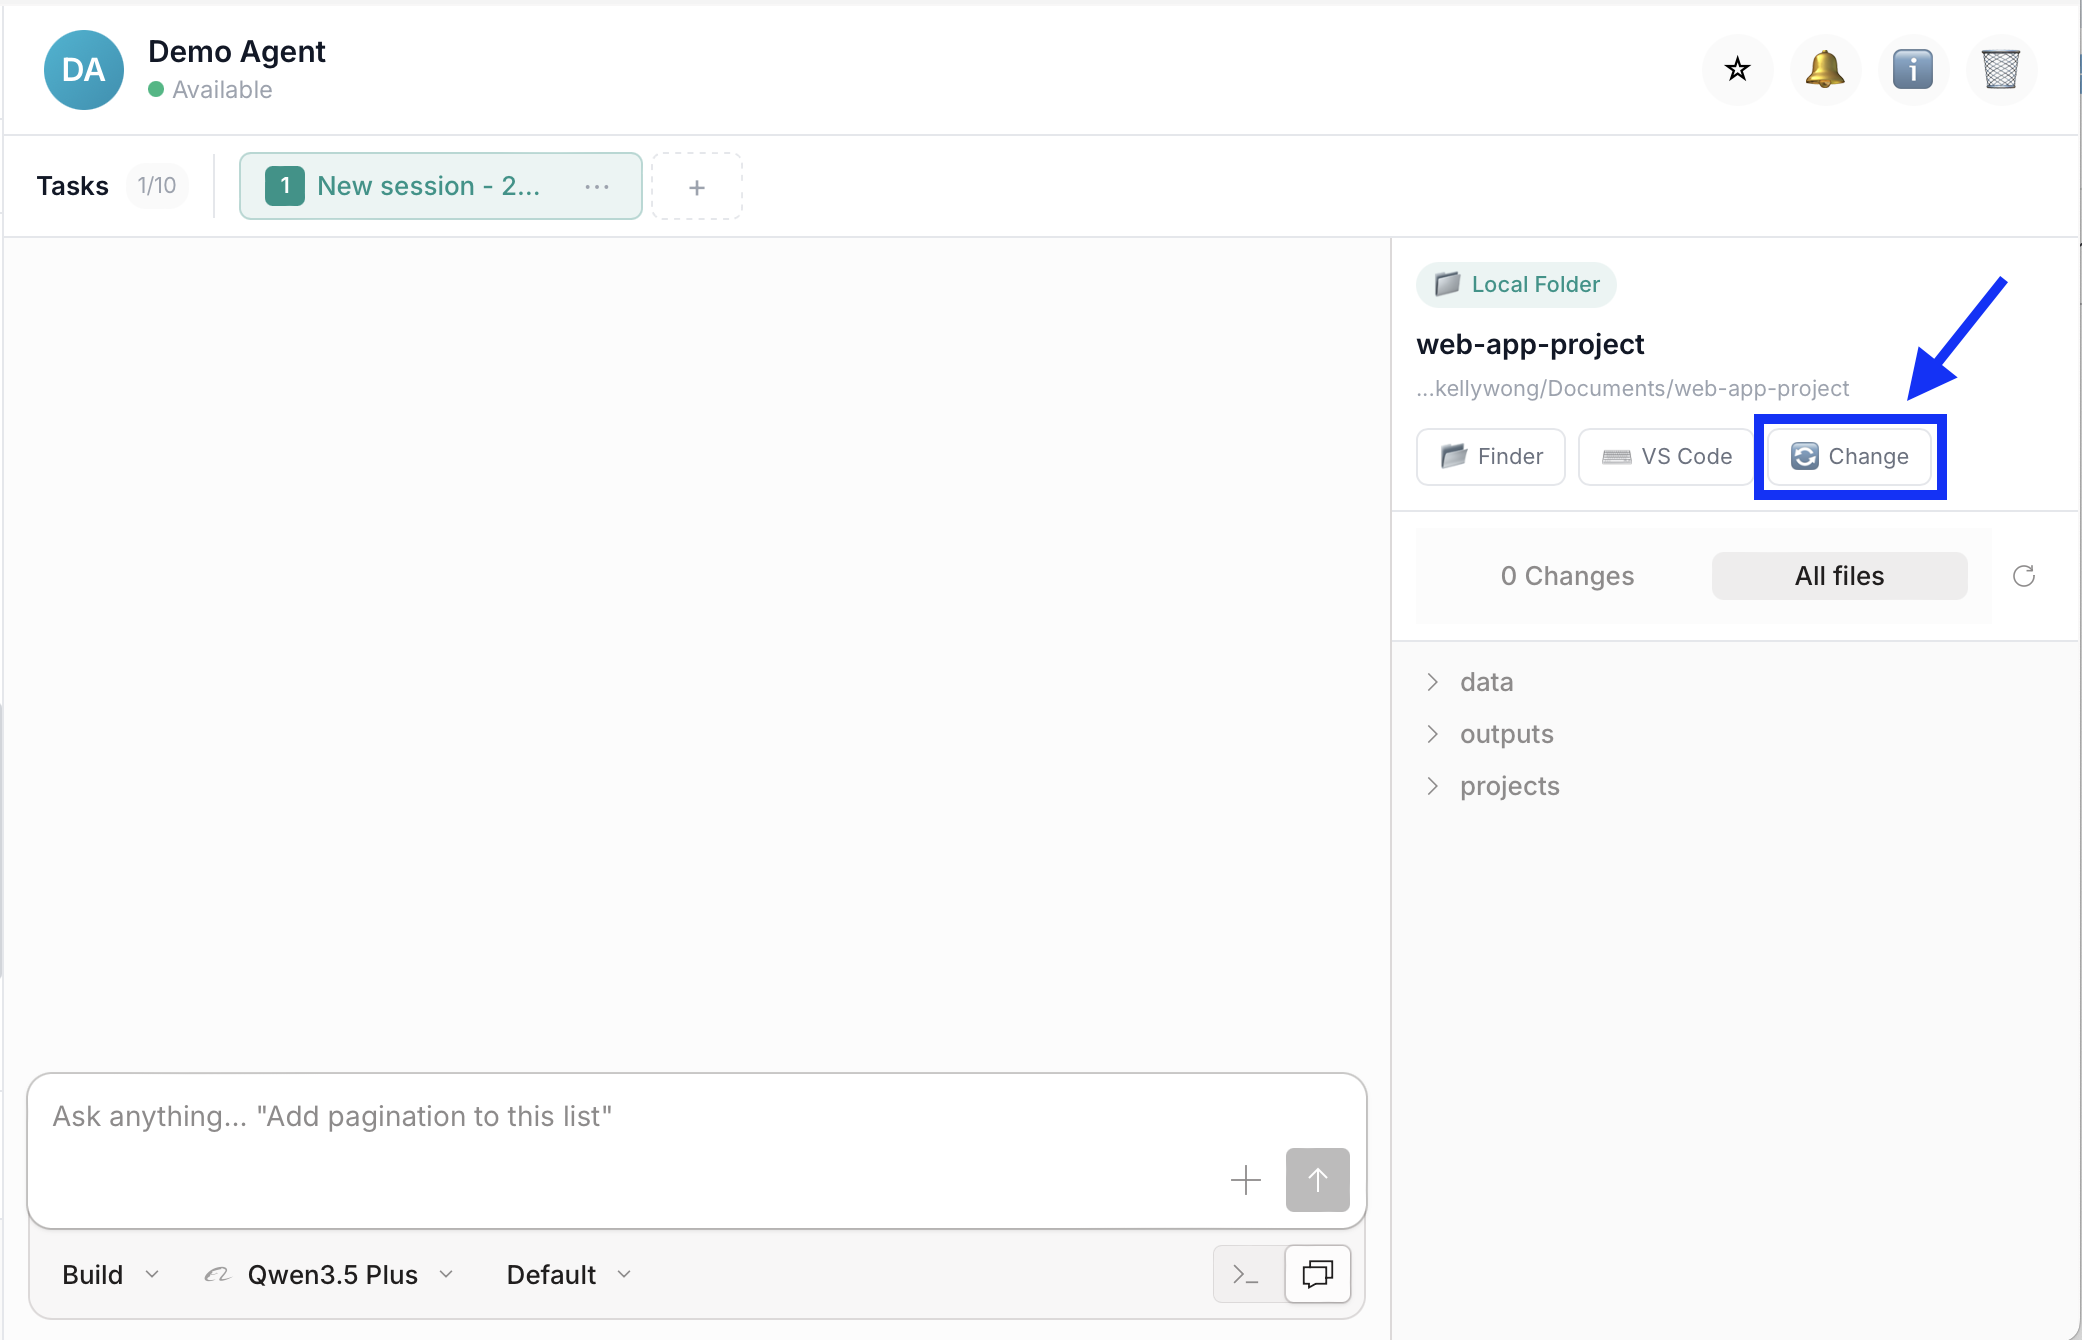
- Add your files into that folder
Step 4: Give Your Instruction
To generate your strategy recommendations, use one of the instruction examples in the next section as your starting point. Choose the example that best matches your strategy type, then replace the sample file names and details with your own.
How to Use These Templates
The prompts below are templates, replace the [PLACEHOLDER] text with your specific details:
[STRATEGY TYPE]→ Donor Engagement, Sales Optimization, Product Strategy[SOURCE-FILE.xlsx]→ Your data filenames[BUSINESS GOAL]→ What you want to achieve- Adjust segments and analysis to match your needs
Recommended Workflow: Plan First, Then Build
For complex strategy analyses, use a two-step approach for best results:
Step 1 - Plan Mode: Ask your agent to analyze your data and propose an analysis framework before writing recommendations. This helps validate that the agent understands your business context, identifies data gaps early, and allows you to adjust the approach before the strategy is written.
Step 2 - Build Mode: Once you approve the analysis framework, ask your agent to generate the full strategy recommendations following the approved structure. This reduces revisions and ensures better quality since the agent has time to think through the insights.
How to Switch Modes:
Click the mode selector dropdown under the input box and choose between Plan or Build:
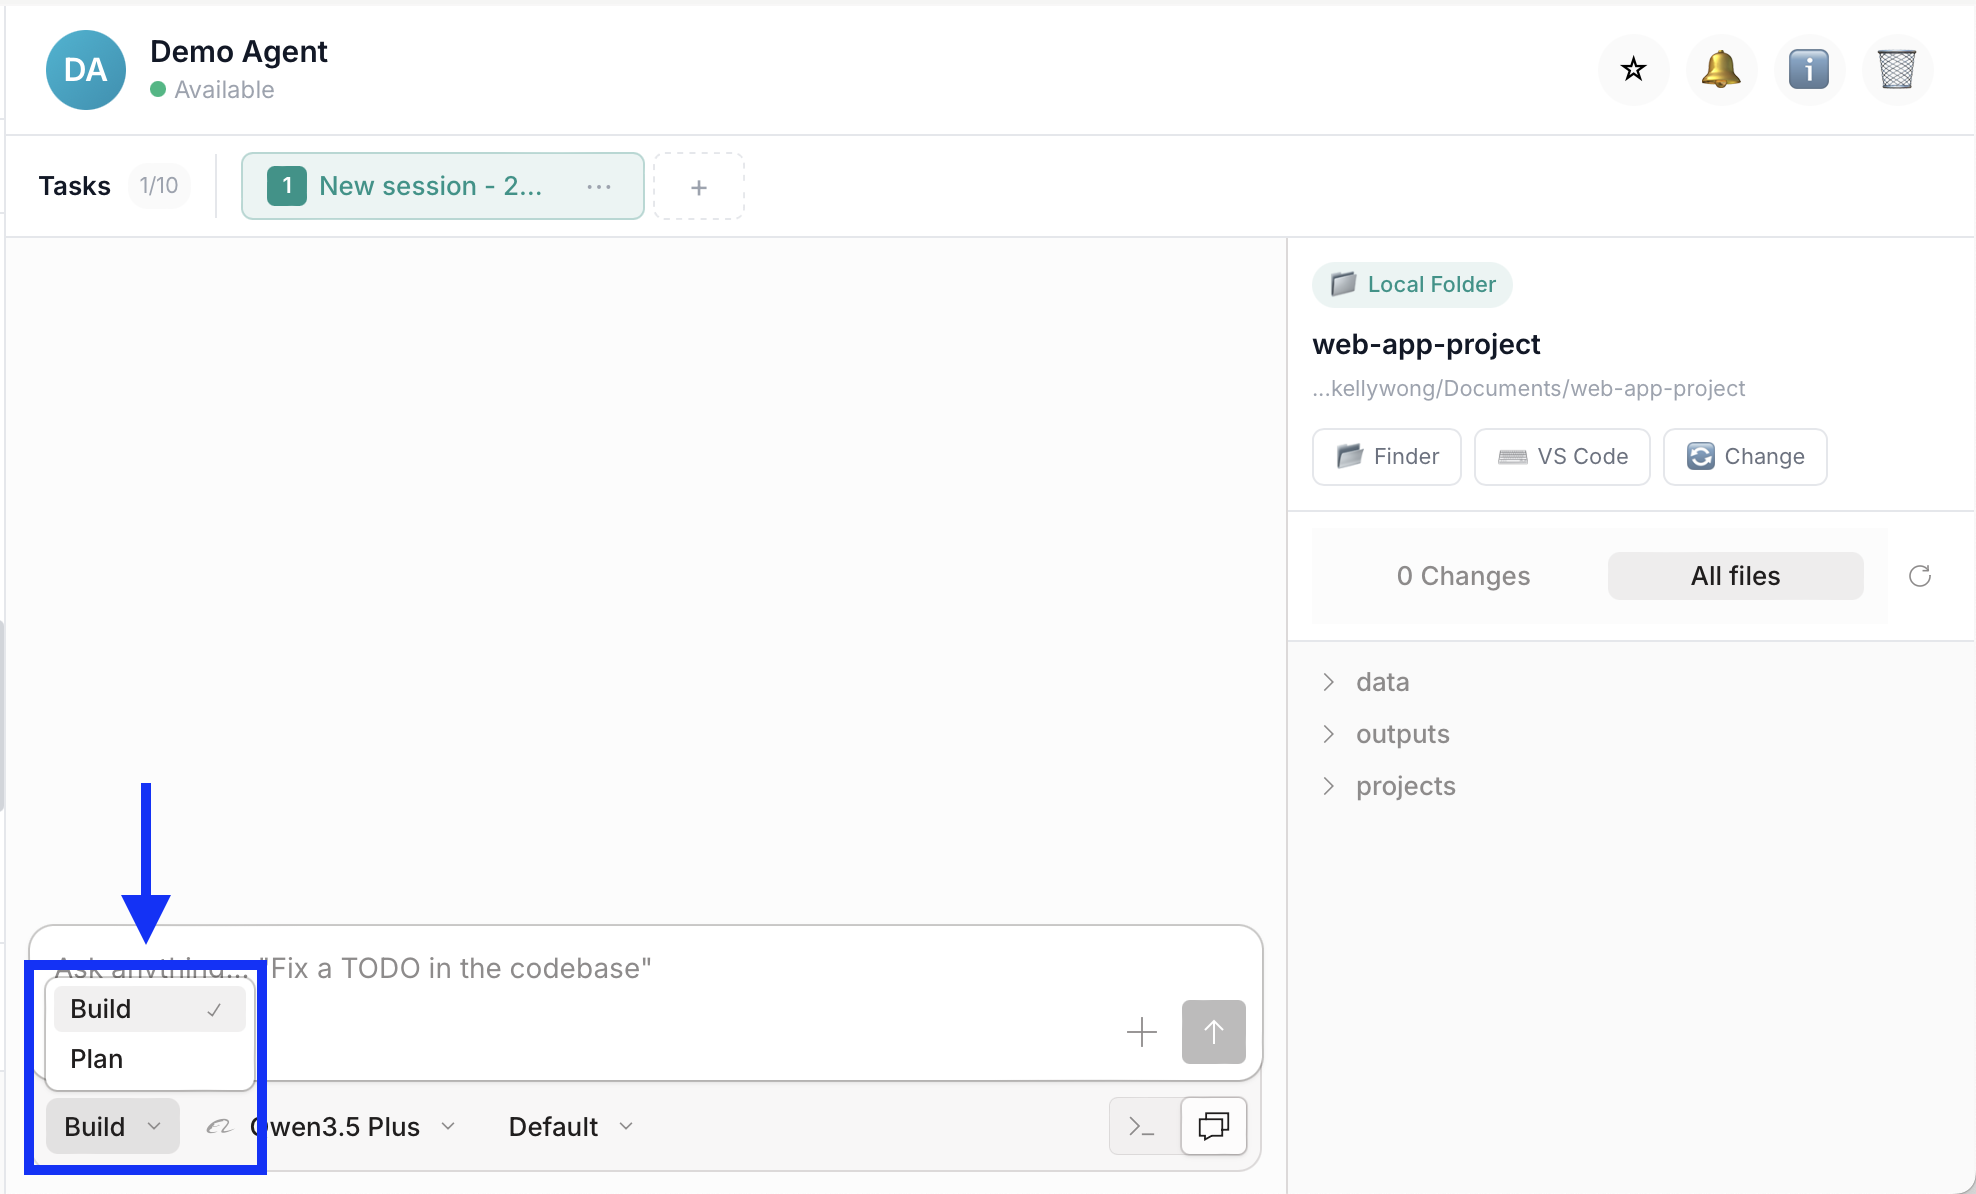
Start in Plan mode to review the proposed analysis framework, then switch to Build mode to generate the strategy.
Why this workflow is more effective: Catches issues early (easier to adjust a plan than rewrite a strategy), aligns expectations, reduces revisions, and results in better quality output.
Instruction Examples
Example 1: Donor/Customer Engagement Strategy
When to Use This Type
Use for: Donor retention, customer engagement, recurring revenue programs, loyalty initiatives
Background: You work at an NGO and need to develop a strategy to improve donor engagement and increase recurring donations. You have donor data, past campaign results, and meeting notes from major donor conversations.
Files Ready in Your Folder:
[DONOR-DATABASE.xlsx]— [Description, e.g., "Complete donor database with 200+ donors, donation totals, engagement levels"][DONATION-HISTORY.xlsx]— [Description, e.g., "Monthly donation trends for 2025 with year-over-year comparison"][CAMPAIGN-RESULTS.xlsx]— [Description, e.g., "Results from major fundraising campaigns"][DONOR-MEETINGS.md]— [Description, e.g., "Meeting notes from major donor conversations"]
Your Prompt:
💡 Pro Tip: Use Plan Mode first (see workflow above) to review the proposed analysis framework before building.
Analyze our donor data and provide a strategy to improve donor engagement and increase recurring donations.

Context:
- Business goal: [e.g., "Increase recurring monthly donations by 30% and improve donor retention rate"]
- Customer type: [e.g., "Mix of individual donors, corporate sponsors, and foundations"]
- Time period: [e.g., "Full year 2025 data plus Q1 2026"]

Source Materials:
- [DONOR-DATABASE.xlsx] — [Description of content]
- [DONATION-HISTORY.xlsx] — [Description of content]
- [CAMPAIGN-RESULTS.xlsx] — [Description of content]
- [DONOR-MEETINGS.md] — [Description of content]

Analysis Required:
1. Donor/Customer Segmentation
   - Segment by [criteria: donation level, type, engagement, etc.]
   - Identify top 20% by value
   - Flag at-risk or lapsed [donors/customers]

2. Pattern Analysis
   - Identify which segments have highest retention
   - Find common characteristics of recurring [donors/customers]
   - Analyze which campaigns had best ROI
   - Spot trends in timing and amounts

3. Strategy Recommendations
   - For each segment, provide tailored engagement strategy
   - Prioritize actions by potential revenue impact
   - Include specific tactics and messaging suggestions

Output Requirements:
- Executive Summary (key findings and top 5 recommendations)
- Segmentation Analysis (with data tables)
- Key Insights and Patterns (what the data tells us)
- Strategic Recommendations (actionable, prioritized by impact)
- Action Plan (specific steps, timeline, responsible persons)
- Success Metrics (KPIs to track)

Tone: [Professional and data-driven, but actionable]
Format: Structured document with clear headings, bullet points, and data tables

Save to: [your-folder]/[strategy-name].md
Expected Output:
Comprehensive strategy document with data-backed insights, donor/customer segmentation, prioritized recommendations, and actionable plan with timeline and success metrics.
Customization Tips
For the NGO donor strategy example:
[Business goal]→ "Increase recurring monthly donations by 30% and improve donor retention rate"[Customer type]→ "Mix of individual donors, corporate sponsors, and foundations"[Analysis]→ "Segment by donation level, type, engagement. Identify top 20%, flag lapsed donors"
For SaaS customer retention:
[Business goal]→ "Reduce churn by 20% and increase expansion revenue"[Customer type]→ "B2B SaaS customers across 3 pricing tiers"[Analysis]→ "Segment by usage patterns, support tickets, payment history. Identify at-risk customers"
Engagement Strategy Tips
✅ Do: Segment by value and behavior, prioritize by impact, include specific tactics with owners
❌ Don't: Make generic recommendations, skip data backing, forget success metrics
Example 2: Sales Pipeline Optimization Strategy
When to Use This Type
Use for: B2B sales strategy, pipeline analysis, conversion rate optimization, account expansion
Background: You're a sales leader analyzing your pipeline to identify bottlenecks and optimize conversion rates. You have CRM data, deal history, and sales activity logs.
Files Ready in Your Folder:
[CRM-EXPORT.xlsx]— [Description, e.g., "All active opportunities with stage, value, close date"][DEAL-HISTORY.xlsx]— [Description, e.g., "Closed deals from past 12 months with win/loss reasons"][SALES-ACTIVITY.xlsx]— [Description, e.g., "Sales rep activity logs (calls, emails, meetings)"][ACCOUNT-DATA.xlsx]— [Description, e.g., "Account information, industry, company size"]
Your Prompt:
💡 Pro Tip: Use Plan Mode first (see workflow above) to review the proposed analysis framework before building.
Analyze our sales pipeline data and provide recommendations to improve conversion rates and increase deal size.

Context:
- Business goal: [e.g., "Increase win rate from 25% to 35% and average deal size by 20%"]
- Sales cycle: [e.g., "B2B enterprise sales, 3-6 month cycle"]
- Team size: [e.g., "5 AEs, 2 SDRs"]

Source Materials:
- [CRM-EXPORT.xlsx] — [Description of content]
- [DEAL-HISTORY.xlsx] — [Description of content]
- [SALES-ACTIVITY.xlsx] — [Description of content]
- [ACCOUNT-DATA.xlsx] — [Description of content]

Analysis Required:
1. Pipeline Analysis
   - Conversion rates by stage
   - Average time in each stage
   - Identify bottlenecks and drop-off points

2. Win/Loss Analysis
   - Common characteristics of won deals
   - Reasons for lost deals
   - Competitive win rates

3. Strategy Recommendations
   - For each bottleneck, provide improvement tactics
   - Prioritize by revenue impact
   - Include specific playbooks and messaging

Output Requirements:
- Executive Summary (key findings and top 5 recommendations)
- Pipeline Analysis (conversion rates, cycle time, bottlenecks)
- Win/Loss Insights (patterns and competitive intelligence)
- Strategic Recommendations (actionable, prioritized)
- Action Plan (specific steps for next quarter)
- Success Metrics (conversion rate, cycle time, average deal size)

Tone: [Professional, data-driven, action-oriented]
Format: Structured document with data tables and clear recommendations

Save to: [your-folder]/[strategy-name].md
Expected Output:
Sales strategy document with pipeline analysis, conversion bottlenecks identified, win/loss patterns, and prioritized recommendations with specific playbooks.
Customization Tips
For the B2B sales optimization example:
[Business goal]→ "Increase win rate from 25% to 35% and average deal size by 20%"[Analysis]→ "Conversion by stage, time in stage, win/loss reasons, competitive analysis"
For account expansion:
[Business goal]→ "Increase expansion revenue by 40% through upsell/cross-sell"[Analysis]→ "Current product usage, expansion history, customer health scores"
Sales Strategy Tips
✅ Do: Analyze conversion by stage, identify specific bottlenecks, provide playbooks for each
❌ Don't: Skip win/loss analysis, make generic "sell more" recommendations, forget competitive context
Example 3: Product/Service Strategy Recommendations
When to Use This Type
Use for: Product roadmap prioritization, feature adoption analysis, service improvements, user experience optimization
Background: You're a product leader analyzing user behavior data to prioritize the product roadmap and improve feature adoption. You have usage analytics, user feedback, and support ticket data.
Files Ready in Your Folder:
[USAGE-ANALYTICS.xlsx]— [Description, e.g., "Feature usage data by user segment for past 6 months"][USER-FEEDBACK.xlsx]— [Description, e.g., "User survey responses, NPS scores, feature requests"][SUPPORT-TICKETS.xlsx]— [Description, e.g., "Support tickets categorized by issue type"][ROADMAP-DRAFT.xlsx]— [Optional, e.g., "Planned features for next quarter"]
Your Prompt:
💡 Pro Tip: Use Plan Mode first (see workflow above) to review the proposed analysis framework before building.
Analyze our product usage data and provide recommendations for roadmap prioritization and feature adoption improvements.

Context:
- Business goal: [e.g., "Increase feature adoption by 40% and reduce churn by 15%"]
- Product type: [e.g., "B2B SaaS platform with 5 core modules"]
- User segments: [e.g., "Admin users, end users, power users"]

Source Materials:
- [USAGE-ANALYTICS.xlsx] — [Description of content]
- [USER-FEEDBACK.xlsx] — [Description of content]
- [SUPPORT-TICKETS.xlsx] — [Description of content]
- [ROADMAP-DRAFT.xlsx] — [Optional: planned features]

Analysis Required:
1. Feature Adoption Analysis
   - Usage rates by feature and user segment
   - Features with highest/lowest adoption
   - Correlation between feature usage and retention

2. User Pain Points
   - Common support issues and feature requests
   - NPS drivers (promoters vs. detractors)
   - Usability issues from feedback

3. Strategy Recommendations
   - Prioritize roadmap items by impact on adoption/retention
   - Suggest improvements for low-adoption features
   - Include specific tactics for each recommendation

Output Requirements:
- Executive Summary (key findings and top 5 recommendations)
- Feature Adoption Analysis (usage rates, patterns, correlations)
- User Pain Points (support issues, feedback themes)
- Roadmap Recommendations (prioritized by impact)
- Action Plan (specific steps for next quarter)
- Success Metrics (adoption rate, NPS, churn rate)

Tone: [Professional, user-focused, data-driven]
Format: Structured document with data tables and clear recommendations

Save to: [your-folder]/[strategy-name].md
Expected Output:
Product strategy document with feature adoption analysis, user pain points identified, prioritized roadmap recommendations, and success metrics.
Customization Tips
For the product roadmap example:
[Business goal]→ "Increase feature adoption by 40% and reduce churn by 15%"[Analysis]→ "Usage by feature/segment, adoption vs. retention correlation, support issue patterns"
For service improvements:
[Business goal]→ "Improve customer satisfaction score from 7.5 to 8.5"[Analysis]→ "Service usage patterns, complaint categories, resolution times"
Product Strategy Tips
✅ Do: Correlate usage with retention, prioritize by impact, include user feedback themes
❌ Don't: Prioritize by loudest customer, skip adoption analysis, ignore support data
Review & Refine
Important: Always Review AI-Generated Output
AI agents are powerful assistants, but human review is essential. Always verify the generated output before using, sharing, or submitting it.
What to Check
After your agent generates the output, review for:
- Accuracy — Verify data analysis and insights match your source documents
- Completeness — Ensure all key segments and patterns are covered
- Actionability — Check that recommendations are specific and implementable
- Data backing — Confirm recommendations are supported by actual data points
How to Request Corrections
If you find issues, continue the conversation with your agent:
For data errors:
"The analysis shows [incorrect insight], but the data from [source document] indicates [correct insight]. Please review and correct."
For missing analysis:
"The strategy doesn't cover [specific segment/pattern]. Please analyze [specific data] and add recommendations."
For generic recommendations:
"The recommendations are too generic. Make them specific to our context by referencing [specific data points/customer names]."
For refinements:
"The tone is too [academic/casual]. Please adjust to be more [action-oriented/executive-friendly]."
Best Practices
✅ Do: Review data accuracy, verify recommendations are actionable, check that insights are data-backed
❌ Don't: Accept generic advice without data backing, skip validation of key findings, implement without leadership review
Remember
Your agent is a collaborative tool. The best results come from AI efficiency + human oversight.
How to Improve Results
Tip 1: Provide Clean, Structured Data
✅ Good: Excel file with clear column headers, consistent formatting, no merged cells
❌ Vague: Scattered data across multiple formats with inconsistent naming
Tip 2: Be Specific About Your Goal
✅ Good: "Increase recurring donations by 30% while maintaining 80% retention rate"
❌ Vague: "Improve our donor strategy"
Tip 3: Include Qualitative Context
✅ Good: Meeting notes, feedback summaries, conversation highlights that explain the 'why' behind numbers
❌ Vague: Only quantitative data without context
Tip 4: Request Prioritized Recommendations
✅ Good: "Rank recommendations by impact and effort. Focus on top 5 actions we can take in Q2"
❌ Vague: "Give us some recommendations"
Tip 5: Ask for Specific Action Plans
✅ Good: "For each recommendation, include: specific steps, timeline, responsible person, success metric"
❌ Vague: "Tell us what to do"
Tip 6: Request Data Visualizations Suggestions
✅ Good: "For each data section, suggest appropriate chart type (bar chart, line graph, pie chart) to visualize the insight"
❌ Vague: "Include some charts"
Tip 7: Iterate on Analysis Depth
After reviewing the first output:
✅ Good: "This is great! Now dive deeper into the corporate donor segment. What differentiates the top 5 corporate donors from the rest? Can we replicate those characteristics?"
❌ Vague: "Make it better"
Troubleshooting
General Issues
| Issue | Likely Cause | What to Try |
|---|---|---|
| Data too messy to analyze | Inconsistent formats, duplicates, missing values | "Work with available data and note any data quality issues in the output" |
| Not enough data for patterns | Limited dataset or narrow time period | "With limited data, provide directional insights and note confidence levels. Suggest what additional data to collect" |
| Recommendations too generic | Lack of specific context or goals | "Make recommendations specific to our context. Reference actual customer names and data points from the files" |
| Analysis doesn't match your knowledge | Agent missing important context | "Note: We know X is true because of Y. Factor this into your analysis and validate findings against known facts" |
| Overwhelming amount of data | Too many segments or metrics | "Focus analysis on top 20% of customers by revenue" or "Analyze one segment at a time" |
| Need visual charts/graphs | Agent creates text-based tables only | "Suggest specific chart types for each insight. Describe what each chart should show" |
| Want to present to leadership | Output too detailed for executives | "Create executive summary version (1 page) and detailed version. Executive version should focus on decisions needed" |
Strategy-Specific Issues
| Issue | Strategy Type | What to Try |
|---|---|---|
| Segments not actionable | Engagement | "Make segments based on behavior we can influence, not just demographics" |
| Conversion analysis too shallow | Sales | "Break down conversion by deal size, industry, and sales rep. Identify specific bottlenecks" |
| Feature priorities unclear | Product | "Prioritize by impact on retention and adoption. Include effort estimate for each" |
| Missing competitive context | Sales | "Add competitive win/loss analysis. What are we losing to and why?" |
| No clear success metrics | All types | "For each recommendation, define specific KPI and target improvement percentage" |
Related Use Cases
- Create Beautiful Presentation Slides — Turn your strategy recommendations into a compelling presentation for leadership or team alignment
- Auto-Fill Forms — Populate standardized strategy templates or reporting forms with your analysis results